
Reception and Learning of Electric Fields
Greggers U, Koch G, Schmidt V, Dürr A, Floriou-Servou A, Piepenbrock D, Göpfert MC, Menzel R. 2013 Reception and learning of electric fields in bees. Proc R Soc B 20130528
Introduction
Honeybees, like other insects, accumulate electric charge in flight and when their body parts are moved or rubbed together. We report that bees emit constant and modulated electric fields when flying, landing, walking and during the waggle dance. The electric fields emitted by dancing bees consist of low and high frequency components. Both components induce passive antennal movements in stationary bees according to Coulomb's law. Bees learn both the constant and modulated electric field components in the context of appetitive proboscis extension response (PER) conditioning. Using this paradigm, we identify mechanoreceptors in both joints of the antennae as sensors. Other mechanoreceptors on the bee body are potentially involved but are less sensitive. Using laser vibrometry we show that the electrically charged flagellum is moved by constant and modulated electric fields and more strongly so if sound and electric fields interact. Recordings from axons of the Johnston organ document its sensitivity to electric field stimuli. Our analyses identify electric fields emanating from the surface charge of bees as stimuli for mechanoreceptors, and as biologically relevant stimuli which may play a role in social communication.
Here we present additional background information relating to our recent publication: The work was supported by the Dr Klaus Tschira Stiftung
Electronic supplementary material is available at http://dx.doi.org/10.1098/rspb.2013.0528 or via http://rspb.royalsocietypublishing.org.Electronic
1. Intercommunication in insects using Coulomb forces based on positive surface charge
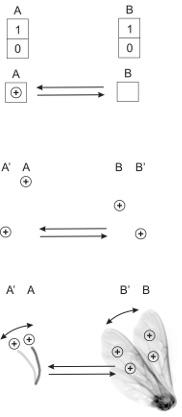 |
Fig. 1 (a) Communication (in information theory) Communication based on one-bit memories at two locations A and B. Each memory content can be displayed as '0' or '1'. Information can be exchanged via a bidirectional connection. Successful communication is reflected in the displays at A and B. |
|
(b) Communication (based on charges of equal sign at locations A and B) The absence of charge at both locations can be interpreted as '0'. The presence of an exclusive charge at a single location A or B can be interpreted as '0' as well. When an equally signed charge is introduced in the uncharged location both charges immediately move to locations A' and B' displayed as '1'. |
|
|
(c) Communication (in biology) For example, both the flagellum (left side) and one wing (right side) of different bees are charged positively. When the wing swings from position B to B' the coupling Coulomb forces will move the flaggellum from A to A'. Bidirectionality is given when the other bee starts to move its wing. Although the movements of the body parts can easily be observed, the interpretation is restricted to zeros and ones. The basic mechanism of communication is demonstrated here, but an explanation of the animals' motivation to transmit and the interpretation by the receiver are still missing. |
2. Physical principles
Here we present the theory of coupling between charged insulators and the calibration of devices for measuring the force of electric fields. According to Coulomb´s law the force between two charges is directly proportional to the product of these charges and inversely proportional to the square of the distance between them. In the case of two positive charges q1 and q2 at rest, each charge has two roles: firstly, each charge creates an electric field with a field strength E which is inversely proportional to the square of the distance r from its source.
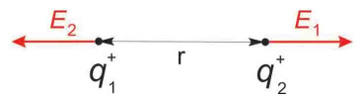
Fig. 2
q1 generates a field strength of |E1|(r) = k • q1 / r2
q2 generates a field strength of |E2|(r) = k • q2 / r2
Note that in this case the principle of superposition is not applicable to calculate the resulting fields. Secondly, each of the two charges has a repellent action on the electric field of the other charge.
|F1| = q1 • E2(r) = q1 • k • q2 / r2
|F2| = q2 • E1(r) = q2 • k • q1 / r2
A constant of proportionality k = 1 / 4 π ε0 εr is required to give the strength of the force in newton (N) when q1 and q2 are in coulombs (C) and r in meters (m). Permittivities ε0 εr describe a material's (or matter's) ability to transmit (or "permit") an electric field.

Fig. 3 Capacitive coupling of charged insect body parts
In the case of multiple charges at rest e.g. on flagellum (left side) and wing (right side), the Coulomb forces are calculated separately for each pair of charges as described above. The overall repulsive force along the direct line between each group of charges Q is the vector sum of all Coulomb forces (in this case the principle of superposition applies). Simplifying the complex conditions in the case of wing-flagellum electric field coupling, we assume conditions close to those in a capacitor with a strong geometric asymmetry. The strongest coupling effect results from r1 via E1, the orthogonal vector between the two charged insulators, because the distances and the angles increase for other vectors. Thus the repellent force acts predominantly along the direct line between wing and flagellum. Manipulating the size of the wing indicated that only about 10% of the wing surface is required to cause the coupling effect (the surface ratio between a normal wing and the flagellum is about 40 : 1, thus a ratio of 4:1 is effective). During flight, all body parts of the bee are exposed to similar air friction with the wing moving only slightly faster. The polarity and strength of the charges produced differ according to the materials, surface roughness, temperature, strain, and other properties such as the degree of ionization in air. Given enough time, charging will reach a balanced state. If the concentration of positive charge per volume in the air drops, the animal will start to discharge. Overall the surface charge per equal area will be constant. Note: Here the rational 'capacitive coupling' is restricted to the description of the forces between site-specific charge on insulators. The frequency response of the moving body parts is based mainly on mechanical parameters of the arrangement. In capacitors with conductive electrodes, as typically used in electronic devices, signal transfer depends on AC-coupling i.e. on moving charge and its time constants. In addition, the mechanical force between both electrodes, which are normally fixed and cannot move, is often described in the literature as depending 'solely' on the potential difference (voltage) or the strength of the electric field in V/m. Unfortunately, these simplified descriptions are not satisfying, as shown in figure 2. The fact that both charges are the very same clearly results in a 'zero' potential difference (voltage). The average strength of the electric field between both charges is 'zero' as well, but the repellent force is active.
3. Example of a detector for recording modulated electric fields
The sensor for measuring the electric fields of dancing bees consisted of a transparent flat sensor with two round Plexiglas plates at a distance of 0.5mm filled with a low concentration (0.1 molar) of an electrolyte (KCl). The sensor was located directly above the respective animal in an open observation hive and allowed video recording of the dance communication process.
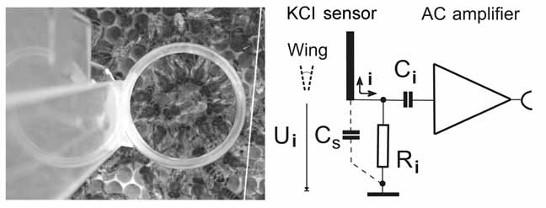
Fig. 4
The conducting fluid between the two transparent plates made contact via a ring-like Ag wire (diameter 0.5 mm) to the input of an AC amplifier mimicking the average diameter of the dance rounds. The location of the sensor for measuring the electric fields of dancing bees was chosen according to the area used by the dancing bee. Such geometry of the flat electrode was necessary for detecting the complex spatial-temporal movements of the body parts of the dancing bee. The concentration of KCl was kept low (0.1 M) to avoid strong electric field reflections. As shown here the sensor of the electrometer is positioned at a defined distance r (approximately 1cm) from the bee's body with its moving wings. Assuming an equal distribution of charge Q1 to Qn along the surface area elements a1 to an (see the figure 3), the surface potential U can be determined as a function of the distances r1 to rn between coupling areas of the wing and the electrometer electrode. The moving wing with a constant surface potential Ui at a distance r to the sensor of the electrometer will induce an electric displacement current (i) in the sensor. The electrometer can be calibrated for similar distances with known surface potential. The absolute calibration was achieved by measuring relative voltage of a very thin metal plate of the same size and shape as a bee wing connected with a thin flexible wire to a 200 V DC voltage source. This metal plate was vibrated like a bee wing at various distances to the detector. Surface areas of the unshielded parts of the receiving and transmitting electrode are taken into account following the guide line as described above for the ratio of the effective capacitive coupling between flagellum and wing. Stray-capacitance Cs is minimized to avoid loss of input sensitivity by the voltage divider Cwing in series with Cs . Stray-capacity compensation circuits are used thus ensuring the absolute sensitivity of the detector device (not shown). Ri is set to 100MΩ to keep the high input impedance of the instrumentational amplifier (AD624, Analog Devices, adjusted to a -3 db bandwidth of 1Hz - 44kHz by the recording software, Ci > 10nF, unipolar) and, in addition, to avoid charging of the KCl electrode by ionized air turbulence from the wing or by direct contact.
4. The relationship between relative force (or relative surface voltage) and the distance to the charge detector.

Fig. 5
The ordinate gives the relative voltage nominated as the attenuation coefficient for the oscillation amplitude of the voltage source. Movement of the wing in the near field (near) induces high modulations of voltage readings and correspondingly high modulations of force. Movements at far distance (far), only low modulations. However, if the dielectric medium has a very high permittivity compared to air e.g. in the case of a bee standing between an emitting bee and a receiving bee even far distant movements will lead to high modulations. The dielectric medium increases the coupling capacity which decreases the surface voltage of the wing. In consequence, the fast moving wing will gain an additional charge by friction ('dielectric charging') resulting in an increase of the effective Coulomb forces. A similar effect can be achieved by a conductive medium such as hemolymph. Notice that the distance between wings of a dancing bee and the flagellae of dance-following bees lies in the range of 0.5 to 4 mm. The DC component shown was calculated and cannot be read by the electrometer directly due to the capacitive coupling of the voltage signal with the sensor. The calibration function (green line) was measured for each detector device, and the asymmetry of the signal detected was used to derive the DC potential shown as offset in the figure. Notice that the received signal is distorted by the non-linear calibration function. This distortion provides us with the information for reconstructing the original signal including the DC offset. By reading the vibration amplitude and distance to the source we can identify the part of the green calibration function which can then be used to reconstruct the original signal. The corresponding static relative force for the example 'near' is 0.6. In the case of hemolymph between wing and electrode or flagellum both higher electric conductivity and permittivity bridges the containing volume and by this leads to stronger capacitive coupling due to the fact that the distance as given as an example is effectively decreasing from 6.5 to 2 mm. Note that the strength of the electric field declines in a similar way to that predicted by Coulomb's law. Side effects from capacitive coupling and unwanted stray-capacities influence the decline. For example, the effective capacitive coupling increases for the 'far' example due to a decrease in α for the same charged area elements (see figure 3) leading to a calibration function which is less steep than expected. A ratio of 4:1 is given for the 'near' example.
5. Electric coupling of wing and flagellum according to Coulomb's law.
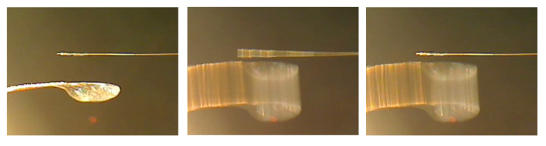
Fig. 6 (a)
Left: The flagellum is glued to the tip of a human hair, which simulates the muscle force and joint flexibility of the flagellum. The wing is mounted to a thin plastic stick driven by a loudspeaker with its sound suppressed and placed at a distance of 3mm from the flagellum. Middle: The wing vibrates at the resonance frequency of the hair to keep the coupling force at a minimum. The wing swing amplitude is 3mm . Right: Discharged flagellum (or wing). The coupling effects from the acoustic force can only be seen at high resolution. This demonstrates that the driving electric force F is proportional to the product of Qflagellum or Qwing according to Coulomb's law. When one of the charges Qflagellum or Qwing is zero or neutral, an electric field but no force can be detected between the body parts. Here we demonstrate the discharged flagellum as the wing is likely to recharge immediately and override the acoustic response. Charging the wing with Styrofoam at low levels suppresses any effect from the wing beat for a very short time because air velocities and Coulomb forces temporarily undergo a phase shift of 180 degrees. This condition might be relevant for the communication between bees at higher levels of humidity outdoors as the change in sign of air ionization causes the bees to charge negatively during flight.

(b) Antenna of the bee (electron microscopy) Tsujiuchi, S., Sivan-Loukianova, E., Eberl, D. F., Kitagawa, Y., and Kadowaki, T. 2007 Dynamic range compression in the honey bee auditory system toward waggle dance sounds. Plos One 2, e234

(c) Pedicel (middle) of the bee with Johnston's organ detecting bends at the joint with the flagellum (right side, electron microscopy)
6. Positioning of a live bee for laser vibrometric measurements of its antennae.
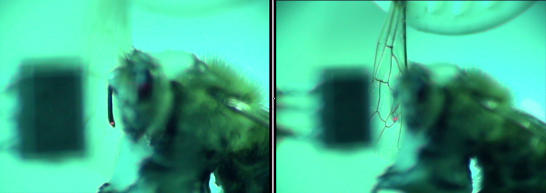
Fig. 7
The left figure shows the position of one flagellum, the right figure depicts the vibrating wing in front of the test animal. The red point shows the laser beam. The black square in the background is the sound pressure detector. The images were taken with the calibration camera of the set-up. Dancing bees produce air flows and electric fields, both of which induce vibrations of the antennal flagellum. Such flagellar vibrations were observed when we oscillated an isolated wing placed 2 mm from the bee’s head with an oscillation frequency of 40 Hz producing both air flow and electric field. In order to compare antennal vibrations with and without charge on the test antenna and/or on the stimulating wing they were discharged by water. During the first few seconds the vibrating wing recharged allowing us to measure the effect on a charged or discharged antenna either in combination or separately. Laser Doppler vibrometric measurements revealed that the flagellum did vibrate in response to air flow alone, but the vibration amplitude was increased by almost one order of magnitude. Under all our test conditions the wings had an electric charge due to the nature of their movements (figure 8a). An exception is the wing discharged with water in figure 8a.
Electric fields sufficed to induce flagellar vibrations as confirmed by applying electrostatic force via an electrostatic probe (figure 8b). Hence, electric fields at frequencies as produced during the waggle dance induce vibrations of the antennal flagellum whose amplitudes exceed those caused by air flows of the beating wing. Note that the vibrations were measured at the tip of the flagellum (red dot). The amplitude of the vibrations at the (root) joint between flagellum and pedicel can only be estimated as a fraction due to side effects from capacitive coupling with the flagellum (not taken into account in figure 8).
7. Laser vibrometric measurements at threshold levels of hearing and the role of the static component of Coulomb forces.

Fig. 8
(a) Vibration amplitude of the antennal flagellum as a function of the oscillation amplitude of an isolated wing placed at a distance of 2 mm from the bee's head (oscillation frequency: 40 Hz, n = 3 flagella, means ± 1 S.D. See also figure 7). Vibration amplitudes were measured as Fourier amplitudes at the frequency of oscillation. Light symbols: wing charged by contact to a piece of charged Styrofoam, Black symbols: wing uncharged so that the flagellum is only driven by air flow. (b) Flagellar vibration amplitude as a function of the voltage amplitude of a 40 Hz sinusoid fed to an electrostatic probe placed at a distance of 2 mm from the bee's head. Statistics: Uncharged versus charged bodies differ significantly (df = 1, dferror = 6, F = 8.15, p < 0.029, ANOVA for repeated measures). We tested vibrations up to 350Hz with similar results. For scales see Note in figure 7.
Hearing as described in the literature is based on two mechanisms. Either there is air pressure on a membrane, as in the human ear, or the particle velocity of the air causes the hair (as part of the mechanoreceptor) to bend. Here we state that the static component of Coulomb forces causes an ongoing bending of the hair. Although ongoing perception by the animal is not yet demonstrated, it is the only component which allows the insect to distinguish between an acoustic and an electric signal. Other authors have tried to explain this static component in insects by referring to wing jet streams.
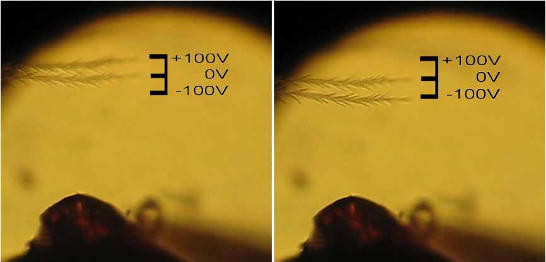
Fig. 9 The -100Vpp square wave signal of a function generator is connected to the unshielded tip of a copper electrode (bottom of both figures). A hair on the side of the thorax near the root of the bee's wing is flipped at a frequency of 2kHz by Coulomb forces. A DC-component of 100V is added to the square wave signal on the left side which is removed on the right side. For a frequency range 0 - 2kHz the amplitude of the hair's movement is constant. This demonstrates the difference of capacitive coupling based on charged insulators and AC-coupling as known for conductive electrodes based on moving charge and its time constants. The absolute movement of the hair depends not only on the driving force but also on its charge (see Fig 6a).
Note: Hairs near the root of the wing are permanent and are the only feathered ones on the bee's body. They may function as an additional capacitor charged by wing friction.
8. The optimal design of the bee's wing for intercommunication
As shown in figure 5, the electric field drops by about 80% at a distance of 1 cm from the wing as a signal source. For optimal communication the geometrical design of a wing should theoretically be built on two factors, first, the wing area should be at least four times that of the flagellum according to figure 3 and, second, its mechanical movements should have an amplitude in the range of 3 to 10 mm according to figure 5. For the bee both factors are optimized for a strong force switching between very high and very low values of Coulomb forces resulting in a strongly modulated signal which is useful for carrying pronounced information. Movies 1 & 2 demonstrate similarities in the signals of different insects.
movie 1 Signals from the bee's wing during flight. Fixed at the thorax the animal emanates electric fields recorded by a remote electrode.
movie 2 Signals from drosophila's wing during flight. Fixed at the thorax the animal emanates electric fields recorded by a remote electrode (Björn Brembs).
9. Example of a 44kHz high speed electric camera with a 32-electrode array (3 x 3cm spacing) placed on top of the dancing area in an observation hive to record the spatial distribution of electric fields from a dancing bee.

Fig. 12
(a) left: The camera array for measuring the electric fields of dancing bees attached to an observation hive in a double layer faraday cage. right: The 32-electrode array with built in high impedance preamplifiers is placed on top of the dancing area. The spacing is 3cm between electrodes and 3 cm between electrode and bees on the comb. This arrangement is used in the dark.
![]()
(b) top: The camera array for measuring the electric fields of dancing bees attached to an observation hive in a double-layer Faraday cage. The 32-electrode array with built-in high impedance preamplifiers can be placed directly on top of the dancing animal. The electrodes are spaced 3cm apart and the distance between the electrode array and the bees on the comb is also 3cm. This arrangement is used in daylight to allow for both visual observation and video recording. In this image most of the electrodes have been removed to give a clear view of the comb.
bottom: Camera array layout with scale in cm.
44kHz electric camera, technical details
The 32 electrodes are connected to 4 audio recording devices (presonic studio one, 8 channel 24-bit microphone inputs, bandwidth 44 kHz, firewire interface) creating wave files (mono). FET-Preamplifier IC's for each electrode were built into a DIN-jack to allow for remote recordings at low noise levels. Signals from each electrode are processed separately by Spike2 software version 7.00 (Cambridge Electronic Design). Eight Windows Server 2008R2 64-bit are used to record and backup data remotely in a 1Gbit network.
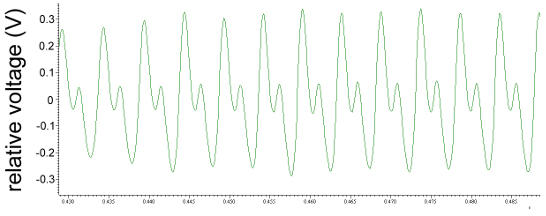
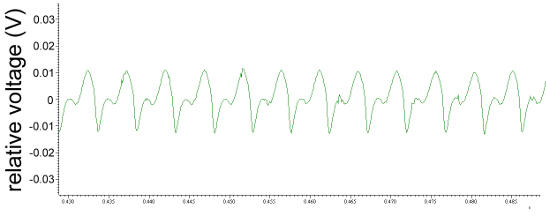
10. Analyzing the data of dancing bees recorded by the 44kHz high-speed electric camera.

Fig. 13
The pattern of electric fields produced by a dancing bee at two temporal resolutions. The electric field pattern was recorded with the transparent sensor (see figure 4). The high frequency components of the full electric field pattern produced during the straight waggle phase lasting for 1700 ms is shown in (c). Figures (a) and (b) give an extended section of the middle part of the pattern as indicated. (a) shows the low frequency components (< 70 Hz) of electric field patterns (not included in (c)), and (b) the corresponding high frequency components (> 70 Hz included in (c)). The time scales for (a) and (b) are the same. Notice that all three subfigures have the same ordinate (electric potential in V). The trace in (c) relates to 12 left-right wagglings of the body. Two groups of typically 3 - 5 wing electric field beats (in (b)) can be seen for each outmost body position (left L and right R) of each waggle. As the abdomen is swinging to the sides (in (a)) it is in addition lowered in the outmost position compared to the middle position (up). This combination of movements results in different effective distances to the recording electrode, leading to a modulation of the electric field signal.
Note the signal trace in (a) is as seen by the detector. For the bee aside the dancer this low frequency component is received with a higher modulation similar to the amplitude given in (c) for the high frequency component. This results from the mechanical swing of the abdomen which is more than 6 mm and thus roughly 2-3 times that of the up/down movement. One should keep in mind that the signals from the electrodes reflect a typical projection seen from above only. The dance followers receive a different pattern of the complex signal depending on their position in relation to the dancer.
movie 3 Attending bees surround a dancer during a waggle phase in a circular formation (Tim Landgraf). Up to 12 bees can find a position around the dancer before it makes a full turn to begin the next waggle run. Note the random distribution of the body axis of all attending bees on the comb during the return run. The circular formation during each waggle phase may indicate the effect of a strong signal send in all directions from the dancer rather than a stream lined signal emanating from the tip of the abdomen. The video which is 120 frames per s converted into a playback stream of 30 frames per s. The 'sound' track is produced by an electric recording from a different bee but gives a real impression of the dance rhythm without the mismatch with the artificially slowed down body movement of the dancer. The metallic sound is best heard with headphones capable of reproducing the very low frequency components (e.g. Dr. Beat). Note that the bees in the circle make contact with the (high capacitive) hair near the root of their wings as described in figure 9.
As movie 3 shows follower bees form a circle around a dancing bee leading to multiple capacitive coupling between them. This effect was first measured under natural conditions and then simulated by exposing freshly killed bees on a wax layer to a signal generator radiating ESF signals equal in strength and temporal structure to those found in the natural dance. Both the results of the measurements under natural condition using the 32-electrode array and those of the simulation were expressed in relative terms by setting relative ESF strength to 1 at a distance of 1 mm from the ESF source. For a single follower at a distance of 13 mm, typically a full body length of Apis mellifera, the relative signal strength was found to be .3. However, with multiple followers the signal decreases only to .7 at the same distance figure 14. Both measurements and simulated leaded to the same result. Thus multiple capacitive coupling extends the radiation of ESF of a dancing bee in all directions in the presence of dance followers.

Fig. 14
The spatial pattern of electric fields produced by a dancing bee as recorded with the 32-electrode array (see figure 12). This diagram demonstrates the typical decline of the electric field distribution where no bee is closer than 3cm to the dancer. The array can be moved to ensure that the dancer is centered below one of the electrodes. The time interval used to average the signal proportions between the array of electrodes is kept short to suppress components resulting from the natural movement of the dancer. In fact, with the high-speed camera we are able to read both the dance direction and the exact length of the waggle component reflecting the distance to the food source. The distribution of the decline of the electric field components is plotted in Statistica (Statsoft) as a contour plot. Artificial side maxima as well as values less than about 13 percent are suppressed as noise reduction. Scales are given cm. In general, the signal levels of the received voltages are well above levels from acoustic recordings with a microphone.

Fig. 15
Schematic diagram of multiple capacitive coupling of electrostatic fields, causing Coulomb forces according to the descriptions in figure 3, between a dancer (green) and 3 followers drawn on top of the images of 4 bees. The red bee couples the area of its head directly with the dancer. The signal strength was found to be enhanced by additional pathways formed by the gray neighboring bees which couple with the full sides of their body to the red bee. ESF strength was measured at a distance of 1 mm to the dancer without followers and set to 1. This signal strength decreases to 0.3 +/- 0.05 STE (n= 350) at a distance of 10 mm. With followers the signal decreases only to 0.7 +/- 0.1 STE (n = 350) at the same distance.

Fig. 16
The spatial pattern of electric fields produced by a dancing bee as recorded with the 32-electrode array (see figure 12). This diagram demonstrates the typical decline of the electric field distribution in the presence of 3 dance followers the configuration is shown in figure 13. One can see the shift of the max. value towards the followers. Note: The array can be moved to ensure that the dancer is centered below one of the electrodes, the actual position is 4,4. Scales are given cm.
This increase in the signal distribution can be explained by the higher conductivity of bees’ bodies compared to air, and in addition by the multiple capacitive coupling between the bees’ bodies (see figures 3 and 5). Apparently, attending bees do not need be in close contact with the dancing bee to sense the dancer's Coulomb forces, probably because the Coulomb forces are strong in all directions around the dancer . In addition, the signals seem to be less noisy and to depend less on the distance and direction from the emitter.
In our recent RSPB publication (see link above) we discuss in detail aspects of learning (i.e. PER conditioning) and the animals' reactions to natural patterns (hive recordings) played back as electric fields.
Conclusion: To develop a full picture of this information channel and its role in social communication the distribution of electric fields for all locations inside the colony will need to be monitored in further studies. We expect that a large range of signals in different frequency bands exist inside the colony, possibly providing information about social activities and health conditions.
Electronic supplementary material to our recent RSPB publication is available here
